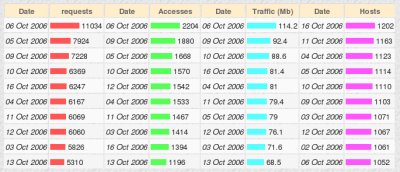
A graph show the number of requests, HTML pages and hosts accessing your
website for each day. The number of days is specified in the configuration file,
default is 50 days. The red bar is the number of hits, the green one is
the number of HTML files (closely related to the number of hits, of
course) and the blue one is the number of different hosts each day.
|
||||||||||||||||||||


|
|
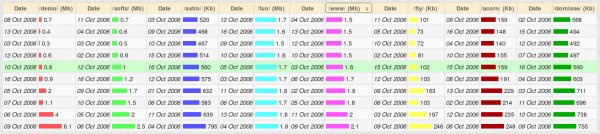
| Daily traffic for selected directories | Peak activities |
Once again, for each day, the graphic show the traffic for each directory specified in the configuration file. Each directory has a different color. Differents options are available to select the total traffic or domain traffic for all files (hits) or the total traffic or domain traffic for HTML pages only.
Also available is the weekly peak activities for each selected directories.
 Daily reports

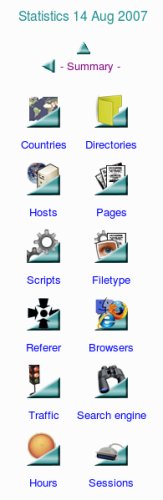
If you want to naviguate through the different days reports, you can either use the calendar or select the day from the graph.
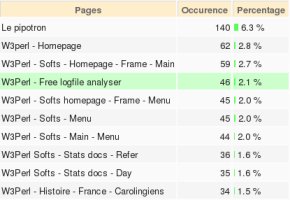
If you click on the graphic, full stats are provided for the day you have selected. Depending your logfile structure, you can have the complete list of hosts, countries, pages, directories, referer, agent, and session stats. Also the hourly stats for the specified day is available if your hourly stats is running at midnight (the hourly stats for the current day is saved at midnight).
A summary for the day, an acces to the textual table containing all the previous days, the average hourly and daily activities can be reach with links.
Daily accesses |
|
Daily menu |
|

Daily directories |

Daily traffic |
|
|

Daily referer |