|
|||||||||||||||||||||||||||||


|

|
|
| Session histogram | Session length | Longuest session |
 Daily visits
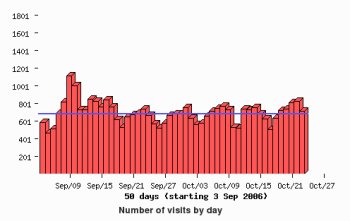
Maybe the most interesting graph in this area is the number of session versus days (i.e the number of different people visiting yor website). The blue line is the average.
|
|
| Daily session | blue tick is average, green one is current |
Clicking on the graph will bring you to the specific day.
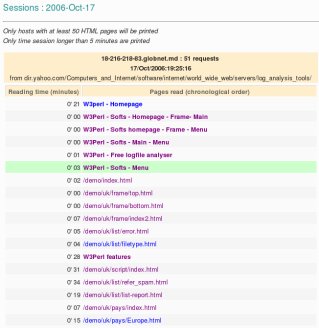
You can specify some filtering option to avoid a too long list to display. Here connection
time should be longer than 5 minutes and the number of HTML pages should
be more than 10.
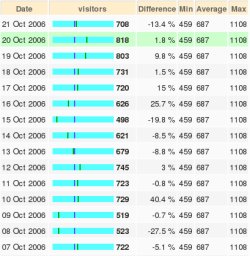
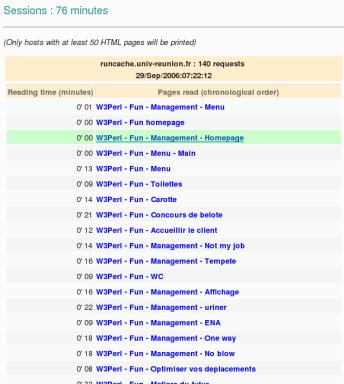
Clicking on the graph or in the textual table allow the full detailed
session to be list for the specified day. A typical session show which
HTML pages have been read and how long for each of them. The referer,
entry point and leaving point are listed when available.

|
|
| List of session sorted by day | Session for one specific day |
Multiple session
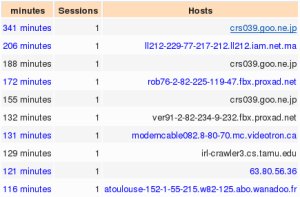
Here you will have the list of hosts which have visiting your website several times. The number of session is displayed along with the number of HTML pages and connection time for each of them. Once again, you can specify display filtering.

|
|
| List of multiple sessions | Sessions sorted by duration |
Session time
The histogram of HTML page reading time is available here.
For a specific connection time, you can view the average HTML pages read, the
host and the number of HTML pages read.
If you follow the link, all sessions with the same connection time are shown.

|

|
| Session time histogram | Host session duration |
Search engine session
Search engine session are listed here.
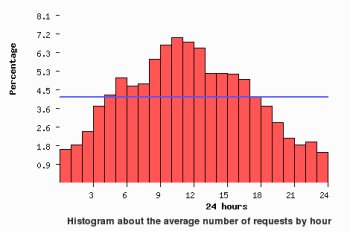
Hourly, daily average
Hourly and daily activities are show. You can easily detect when people are using the most your website. Don't forget this is server time.
Login accesses
If you have a protected area on your website, it is possible to look for people accessing to this area. The hosts connecting are listed.
Average reading time
The average reading time for HTML page is specify here. Grey cells means people pay attention to this page because they stay a while.